Case Study 02
How I Redesigned MoEngage's Menu and Cut Support Complaints by 50%
50% fewer complaints. +15% CSAT. 40% faster navigation. One redesign did it.
At a glance
- Problem
- Navigation complaints kept reaching support — tickets for features that were already in the product and could not be found. The menu was organised by module; marketers worked in a sequence: analyse, segment, act.
- What I decided
- Rebuilt the information architecture around that workflow, tested it with open card sorts and with enterprise customers, and shipped it through UAT and a beta. When moving Create Campaign out of the menu lost people, I added a unified Create button.
- Result
- Navigation time down 40%, navigation complaints down 50%, CSAT up 15%. 85% of users adapted to the new menu without help.
- My role
- Owned it end to end — research, IA, prototyping, testing, rollout and post-launch measurement — with a UX research intern supporting.

01 — The Problem: Death by Clutter
The Problem: Death by Clutter
MoEngage is a MarTech SaaS platform that lets marketers engage users with Push, Email, WhatsApp, and SMS notifications. For an enterprise product like this, the menu isn't decoration — it's the thing standing between a marketer and every workflow they came to run.
It reached me as support volume. Navigation complaints were coming in steadily — people asking where something had gone, or raising a ticket for a feature that was already in the product and simply could not be found.
Before treating that as structural I checked what else it could be. It was not a regression from a recent release: the complaints did not cluster around a ship date. It was not one confused account: they came from across the customer base. And it was not a labelling problem alone, because the same items were being missed regardless of what they were called.
What was left was the structure itself. Every new feature had been added as one more item in an already-flat list, with no hierarchy to say which of those items mattered day to day.
- Too many options, with no hierarchy to separate the frequent from the rare.
- Users couldn't find what they needed, even when the feature they wanted already existed.
- CSAT was dipping and support tickets were rising — the cost was showing up in the numbers, not just in anecdotes.
Imagine logging into your marketing tool and spending minutes just hunting for the "Create Campaign" button. That was daily reality for our customers.
And when navigation breaks in a B2B SaaS product, the cost doesn't stay hidden — support costs rise, complaints pile up, and churn creeps in.
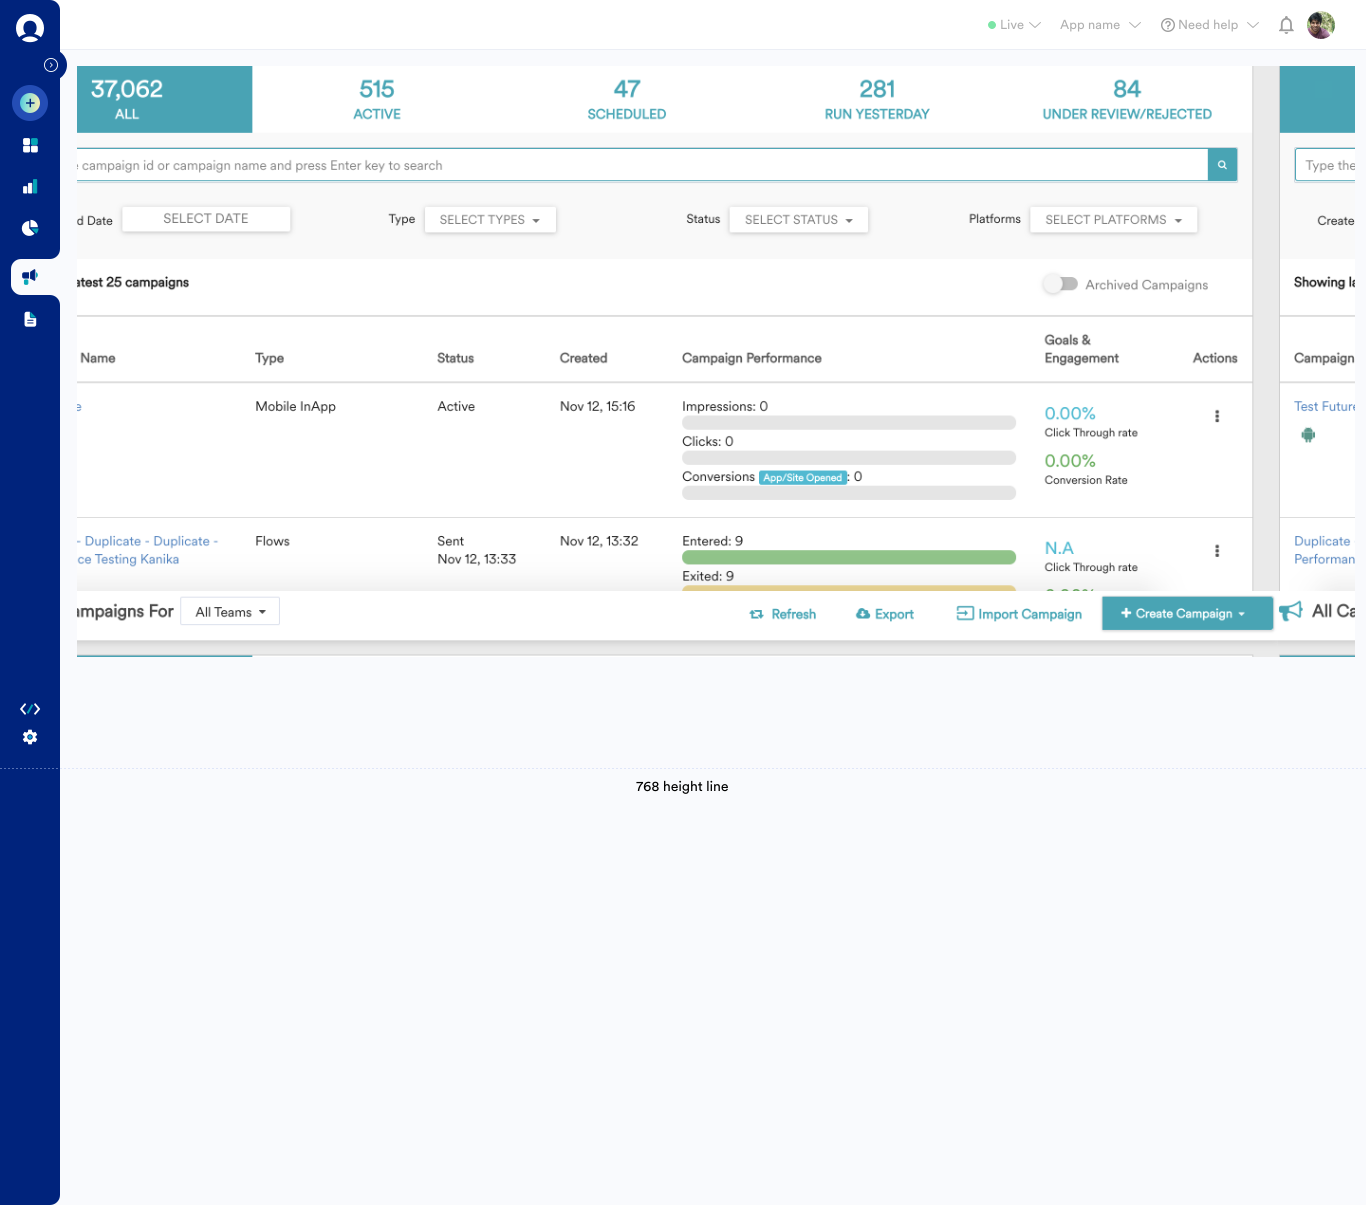
MoEngage menu before redesign
02 — My Role
My Role
I owned
- IA redesign
- Research
- Prototyping
- Testing
- Rollout
- Post-launch measurement
Team contributed
- UX research intern — support
03 — What I Believed Going In
What I Believed Going In
Before opening the data, I wrote down what I assumed was true — so I'd know exactly which of it the research would end up overturning.
- All the users create campaigns and that is what they want to see mostly
- They use settings frequently
- Create campaign is not used from the side nav
- People access all the settings in one place
04 — The Process
The Process
Instead of jumping into Figma, I started with data — partly to design well, and partly to find out how wrong those assumptions actually were.
- Mapped the current IA into a mind map, which surfaced obvious structural flaws before I'd looked at a single number.
- Studied usage metrics — for example, 40% of users moved from Segmentation to Campaigns, but that flow was buried rather than surfaced.
- Formed a hypothesis: the real workflow was Analyze → Segment → Campaign, not the module list the menu was organized around.
- Benchmarked competitors to see how other B2B SaaS products structured their own IA.
- Ran card sorts, which showed marketers and buyers grouped the same tasks differently.
- Prototyped and tested, killing the ideas that didn't hold up and iterating on the ones that did.
- Rolled out in beta and measured adoption and feedback before a full launch.
05 — Understand Current Flow & Metrics
Understand Current Flow & Metrics
Created a mind map to see how the IA of the entire product actually worked, and noted the obvious structural problems before touching any numbers.
Then I looked at the metrics — and realized a few of the assumptions I'd written down going in were wrong.
06 — Summary of Data Analysis
Summary of Data Analysis
40%
Of users go to Segments after data analysis
35%
Of those who clicked Segmentation had accessed Analytics earlier in the same session
40%
Of users want to create a Campaign after segmentation
45%
Of users who clicked on Campaigns had accessed Segmentation just before
94%
Of users create campaigns from the All Campaigns page
93%
Of users created a new dashboard while on an existing dashboard
50%
Dashboard access — Managers
35%
Dashboard access — Admins
30%
Dashboard access — Marketers
Key Findings
- Users followed workflows, not product modules. Their journey typically started with understanding performance, then analyzing data, creating segments, and finally launching campaigns.
- Campaign creation was rarely a fresh task. Most users started from existing campaigns, indicating they preferred duplicating and modifying rather than creating from scratch.
- Frequently connected tasks were separated, forcing users to repeatedly switch between different navigation sections and increasing cognitive effort.
- Dashboard and Analytics were high-frequency destinations, while Settings and configuration pages were accessed infrequently and did not deserve primary navigation.
- Several important features had low discoverability, not because they lacked value, but because users couldn't easily find them within the existing navigation structure.
Design Takeaway
The existing information architecture reflected the product's internal structure rather than users' mental models. The redesign focused on reorganizing navigation around users' natural workflows, reducing navigation effort, improving discoverability, and making common tasks easier to complete.
How traffic flows: Sidebar Analytics → Segmentation → All Campaigns
07 — Hypothesis
Hypothesis
Our users analyze data, create a segment, then create a campaign from the All Campaigns page — looking at a previous campaign, since they already know what they want to create.
Put together, the pattern across the data was consistent: users didn't approach MoEngage as a set of separate modules. They moved through a workflow — analyze, segment, then act — and the existing menu had never been organized around that.
08 — Competitor Analysis
Competitor Analysis
I looked at how competitors structured their menus, and formed assumptions about why they'd made those choices — not to copy a pattern, but to see which parts of the problem were category-wide versus specific to how MoEngage had grown.
Competitor menu structures
09 — Top Problems
Top Problems
Between the data and the competitor read, six problems kept surfacing in the existing menu:
- No visual hierarchy
- No grouping of information
- No defined principles for how one can bring in new features and promote them
- Don't have an understanding of user pain points and how they navigate
- Visually not appealing enough
- Key feature discoverability is low
10 — Validating Hypothesis Using Card Sorting
Validating Hypothesis Using Card Sorting
I ran an open card sort, asking users to sort items and write their own category names — this showed whether the terminology I was using felt technical to them, and whether my hypothesis about workflow-based grouping actually matched how users thought, not just how I thought. I then analyzed that data.
Card sorting sessions with customers and internal stakeholders
I recorded these sessions and analyzed the data using Provenbyusers.com to uncover patterns in how people sorted the cards, then used those patterns to inform design decisions.
After analyzing it came out that there are two types of users.
- Who buys the product
- Who actually uses the product
People who buy the product look at high-level metrics only. Marketers, on the other hand, analyze the data, segment users, create campaigns, and track how each one performs.
Settings, dev docs, integration validation, and getting started are all one-time options that are rarely used — you can see this pattern reflected in the card sort above.
Similarity matrix
Dendrogram representing the grouping in card sorts
11 — What I Took Out of the Menu
What I Took Out of the Menu
Decision
I demoted the one-time setup surfaces out of primary navigation and organised what was left around the workflow, not the product's module list.
The card sort made the split obvious: Settings, developer docs, integration validation and Getting Started are things you touch once and then never again, while Dashboard, Analytics, Segments and Campaigns are the daily loop. A flat menu had been giving both groups equal weight. Demoting the first group is the decision that bought the second group room — and it is the decision people pushed back on, because every one of those items had an owner who considered it important. They were right that it is important. It is just not important *every day*, and primary navigation is a daily surface.
| Factor | For | Against |
|---|---|---|
| Workflow order vs. module list | Matches how people actually move: understand, analyse, segment, send. | Stops matching the internal org chart, so each team has to find its feature somewhere new. |
| Demote one-time setup surfaces | Frees primary navigation for the daily loop; the card sort backs it. | Every demoted item has an owner. Setup is also the first week of every new customer's life. |
| Fewer top-level items | Less scanning at the moment of choice; hierarchy finally says what matters. | More depth. Something people used to reach in one click now takes two. |
| Remove Create Campaign from the menu — reversed | Consistent with the workflow model: you create a campaign from where campaigns live. | It broke an established muscle memory. This one I got wrong and had to undo — see below. |
The last row is the one worth reading. I removed Create Campaign from the main menu because the model said it belonged inside Campaigns. Customers found it immediately, and told us. The fix was a unified Create button that surfaces every creation flow from the menu — which is a better answer than either the old menu or my first version of the new one.
12 — Prototyping & Design Iterations
Prototyping & Design Iterations
I analysed a lot of data — notes, audio recordings, and card sorts.
I also ran card sorts with internal stakeholders. Using this data, I moved into prototyping and then visual design — exploring multiple color and density directions in parallel before narrowing to one, so the grouping logic could be judged on its own merits rather than on a single visual treatment.
You can see the entire design and iterations I have gone through in the link here →Figma file has different pages on the left navigation. Go through them to see the iterations.
Theme exploration — mint, collapsed labels only
Theme exploration — mint, expanded sub-items
Theme exploration — mint, full navigation tree
Theme exploration — teal, icon-only collapsed rail
Theme exploration — dark grey, icon + label rail
Theme exploration — navy, collapsed rail
Theme exploration — purple, campaigns overview
Theme exploration — navy, campaigns overview
Theme exploration — navy, push campaign creation
Theme exploration — navy, full campaign list
Spacing spec — settings menu redline
13 — User Testing & Validation
User Testing & Validation
Before handing over the Information Architecture for development, we validated it through multiple rounds of internal reviews and usability testing with existing enterprise customers. The objective was to ensure the new navigation aligned with users' mental models, improved discoverability, and reduced navigation effort before launch.
Internal Validation
- Participants: Product Managers, Customer Success, Sales, Engineering and Design
- Reviewed navigation hierarchy and feature grouping
- Validated menu labels and terminology
- Evaluated key workflows and edge cases
- Aligned stakeholders before development
Outcome
Refined navigation labels, resolved edge cases and improved cross-functional alignment.
External User Testing
Participants
Existing Enterprise Customers
Tasks
- Find important features
- Create a campaign
- Locate analytics
- Complete common workflows
Metrics Observed
- Task completion time
- Navigation errors
- Feature discoverability
- User confidence
- Overall satisfaction
Outcome
Users completed tasks faster, made fewer navigation mistakes and found the new IA significantly easier to understand.
Iterations Based on Feedback
Based on internal and customer feedback, we:
- Refined navigation labels to match customer terminology
- Reorganized secondary features for better discoverability
- Simplified menu hierarchy
- Improved access to frequently used actions
The Information Architecture wasn't finalized after a single design pass. Multiple rounds of validation and iteration helped de-risk the solution before development and increased confidence prior to rollout.
14 — Final Implementation & UAT Feedback
Final Implementation & UAT Feedback
We ran UAT internally, then opened a beta to a handful of existing customers before considering the redesign done.
- Users reported they could now find everything quickly — the thing the original menu had made unnecessarily hard.
- The UI read as visually cleaner and more intuitive, on top of being easier to navigate.
- One customer went as far as sharing positive feedback about the change on LinkedIn, unprompted.
- 90% of beta users found what they were looking for without help — close to the adoption number the wider rollout would go on to confirm.
15 — Metrics That Improved After Redesign
Metrics That Improved After Redesign
I monitored the following metrics pre- and post-redesign:
- Navigation Efficiency: Metric: Average time taken to find key options. Impact: Reduced navigation time by 40%.
- Feature Discoverability: Metric: Number of users accessing specific features. Impact: Increased engagement with underutilized features.
- Customer Satisfaction (CSAT): Metric: Survey responses post-launch. Impact: CSAT score increased by 15%.
- Customer Support Complaints: Metric: Number of complaints about navigation issues. Impact: Complaints reduced by 50%.
- Adoption Rate of New IA: Metric: Percentage of users interacting with the new menu without external help. Impact: 85% of users adapted to the new IA seamlessly.
16 — Challenges & Iterations
Challenges & Iterations
We went back to customers to understand their feedback on the redesign and inform further decisions.
The redesign received strong feedback overall, but one gap surfaced immediately: some customers couldn't find the Create Campaign action they were used to reaching from the main menu.
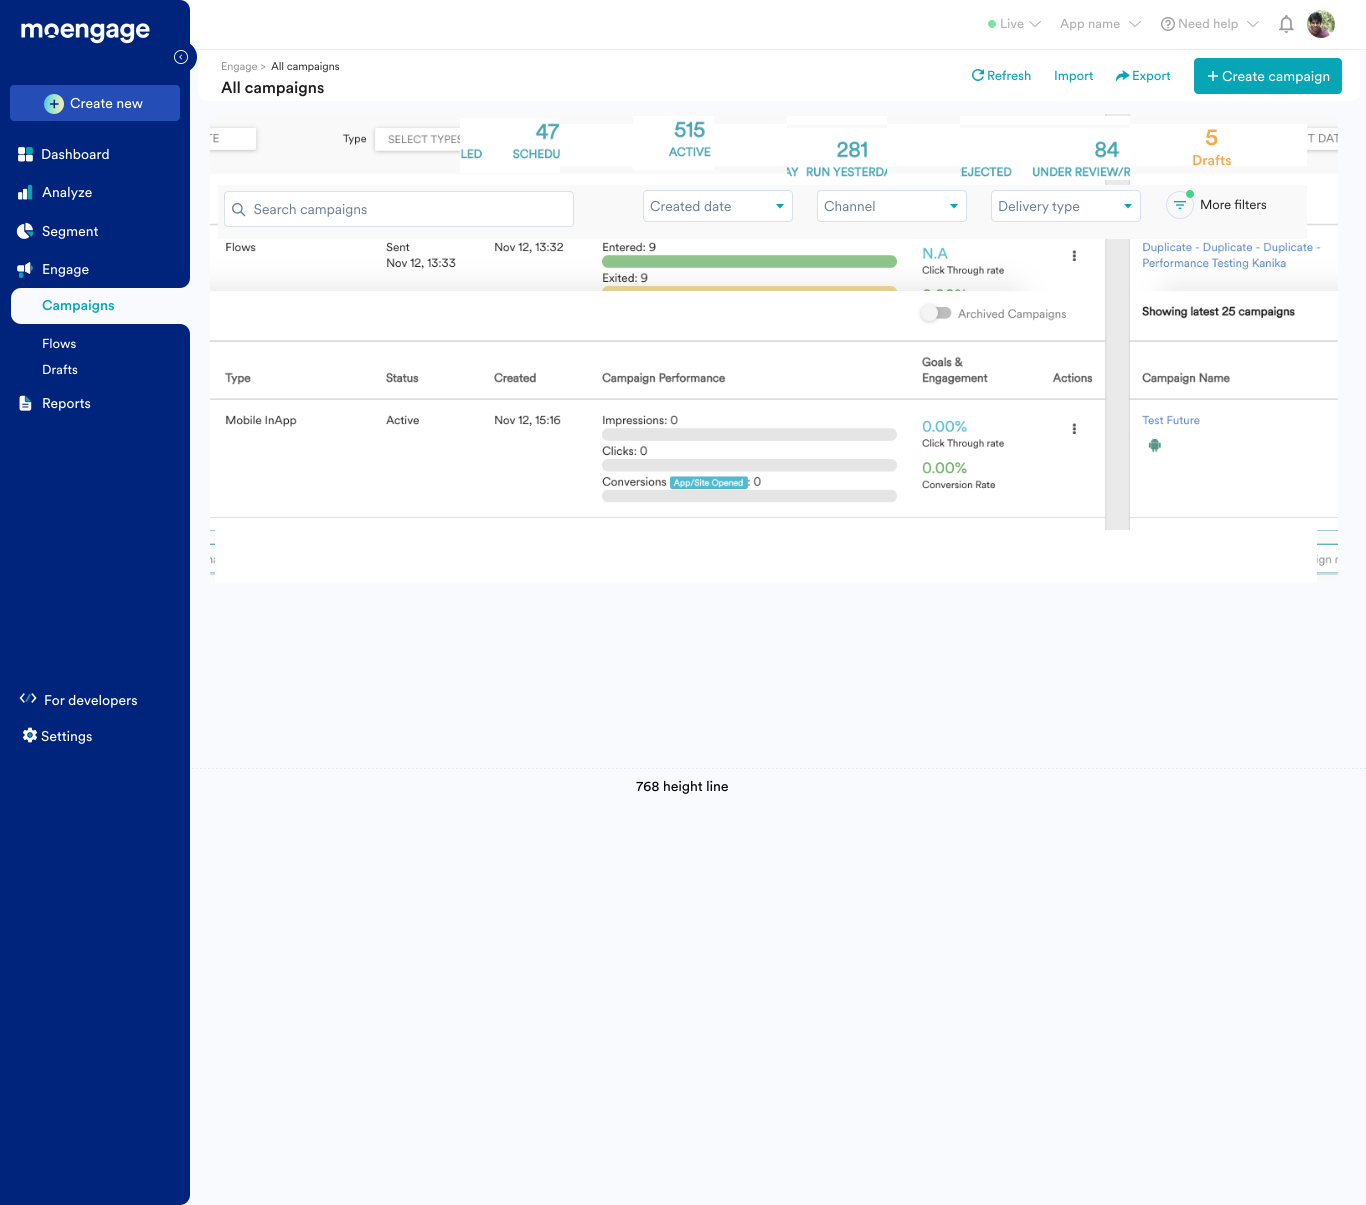
I solved this with a unified Create button that surfaces every creation flow directly from the menu — shown below.
What went wrong
One incorrect assumption was removing "Create Campaign" from the main menu. This broke user mental models, leading to frustration.
How it was corrected
Solution: Introduced a unified "Create" button for easy access to all creation tasks.
17 — Next Steps
Next Steps
- Continuously monitor performance metrics.
- Conduct qualitative user interviews for deeper insights.
- Iterate based on ongoing feedback for further enhancements.
18 — Final Thought
Final Thought
This redesign improved usability, discoverability, and user satisfaction. By making data-driven decisions, I transformed MoEngage's IA into an intuitive experience that empowers marketers.
19 — Design Principles Demonstrated